Dynamic HiC maps
Dynamic view of Figure 1b bottom part using WashU Epigenome Browser from Abramo, K., Valton, A., Venev, S.V. et al. A chromosome folding intermediate at the condensin-to-cohesin transition during telophase. Nat Cell Biol 21, 1393–1402 (2019).
Chrosomose level Dynamic HiC maps
Dynamic view of Figure 1b top part using WashU Epigenome Browser from Abramo, K., Valton, A., Venev, S.V. et al. A chromosome folding intermediate at the condensin-to-cohesin transition during telophase. Nat Cell Biol 21, 1393–1402 (2019).

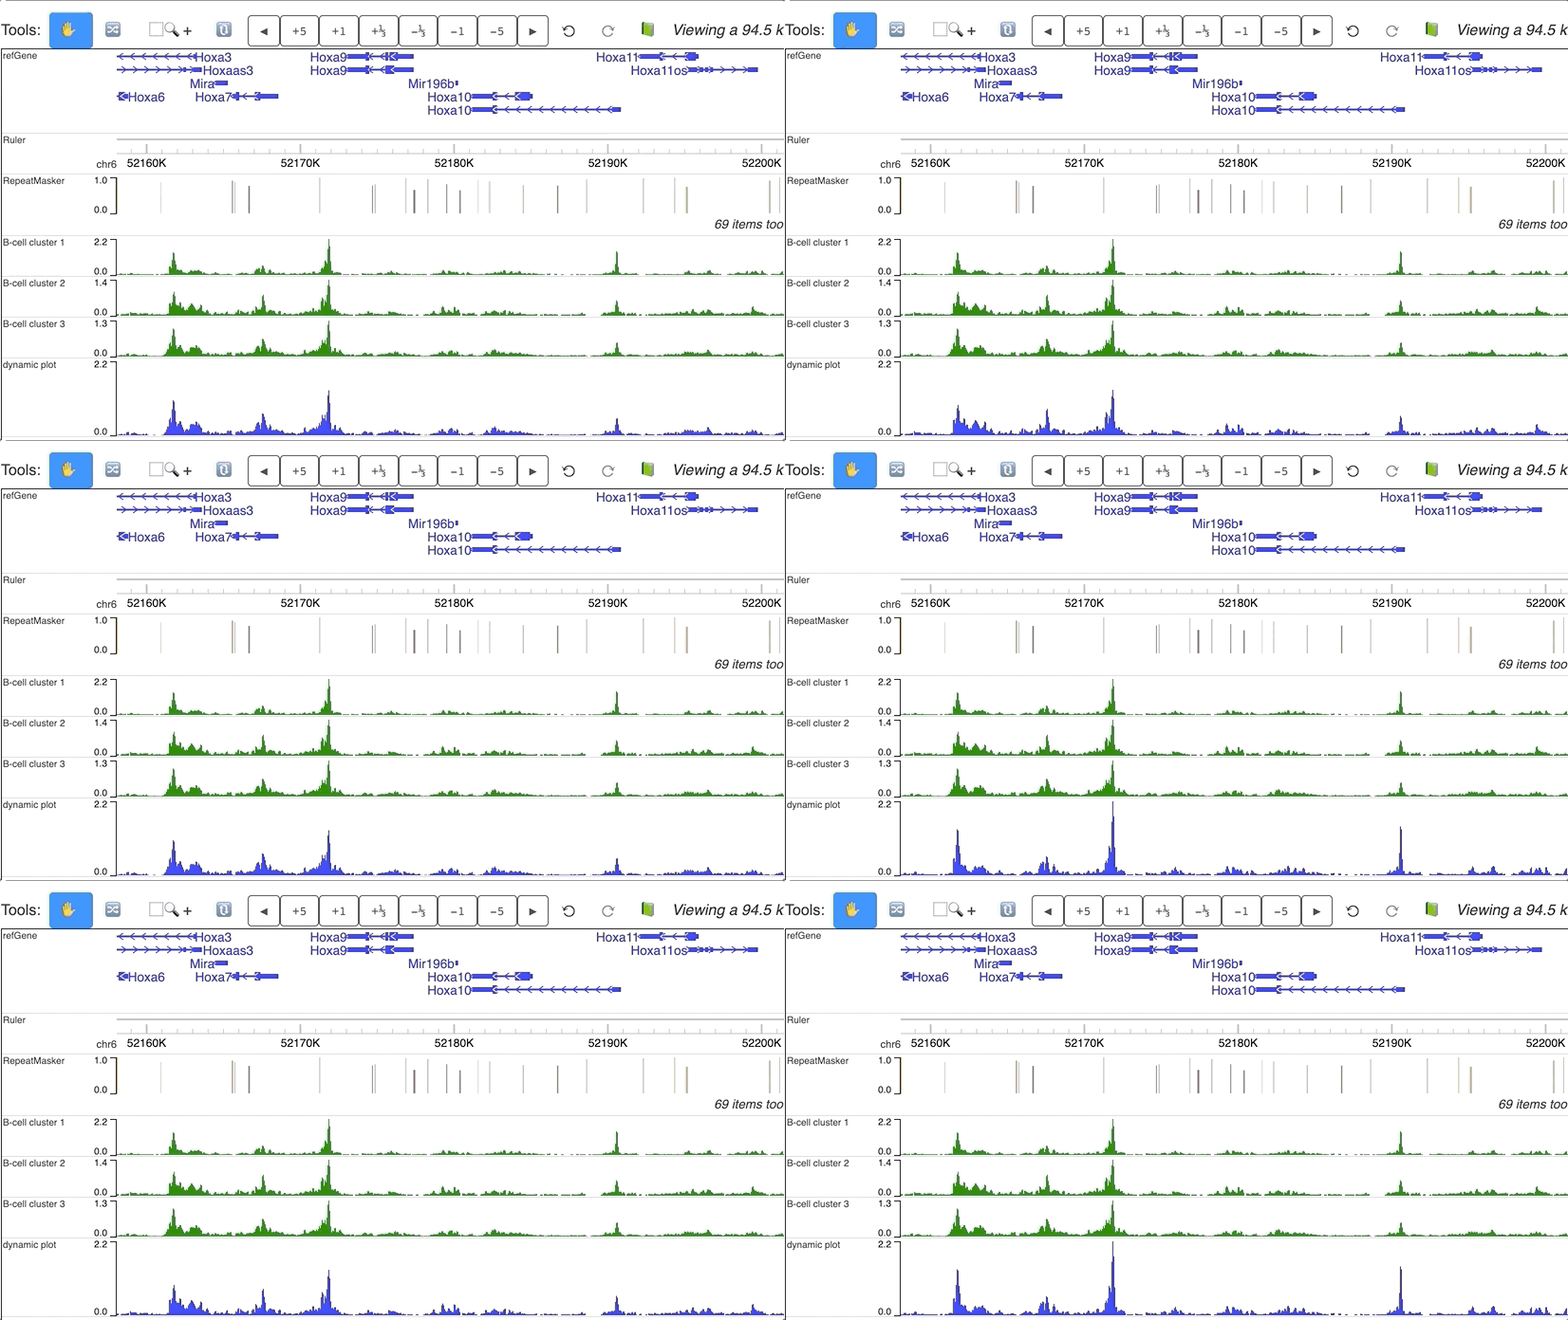
Dynamic numerical tracks
Dynamic view of clusters from single cell data. Data are downloaded from Cusanovich DA, Hill AJ, Aghamirzaie D, et al. A Single-Cell Atlas of In Vivo Mammalian Chromatin Accessibility. Cell. 2018;174(5):1309–1324.e18. doi:10.1016/j.cell.2018.06.052.

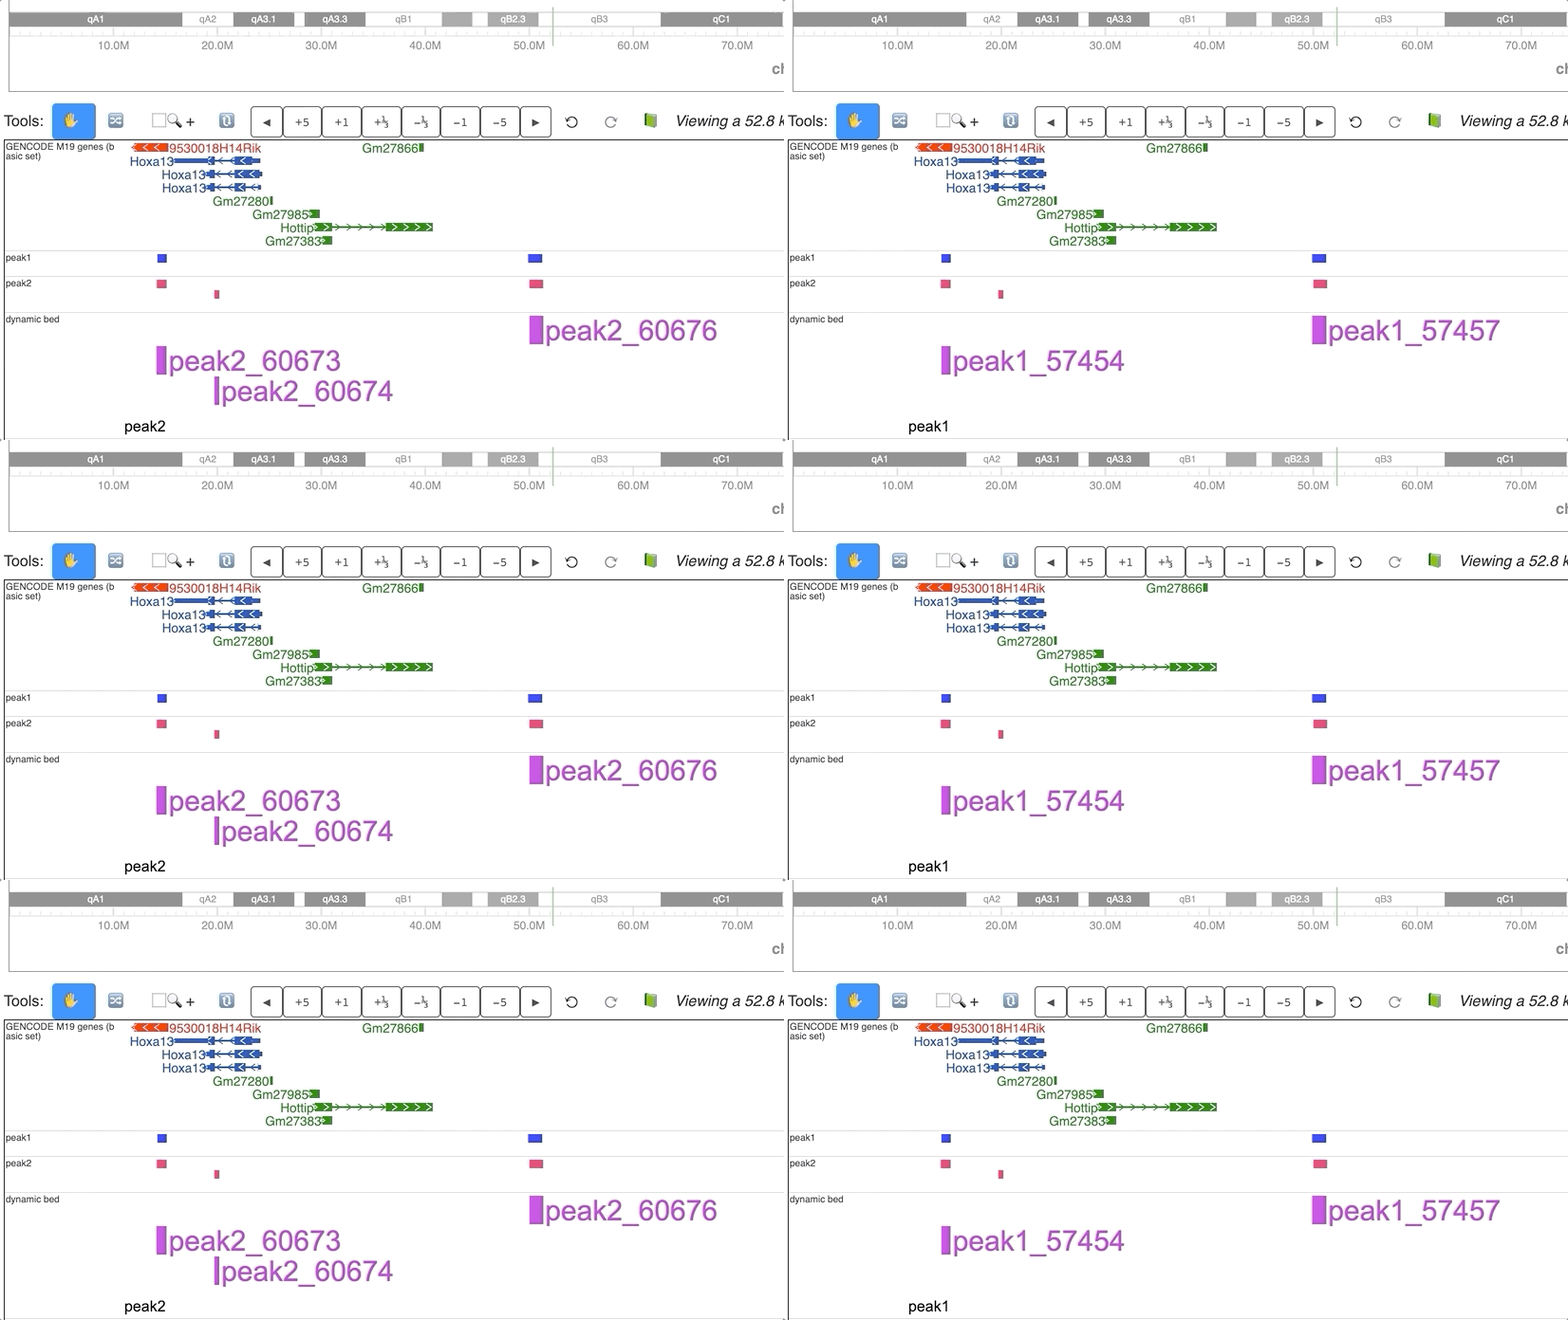
Dynamic annotations (peaks)
Dynamic view of peaks from 2 different groups.